… the gap between rich and poor reduces
Thukten Zangpo
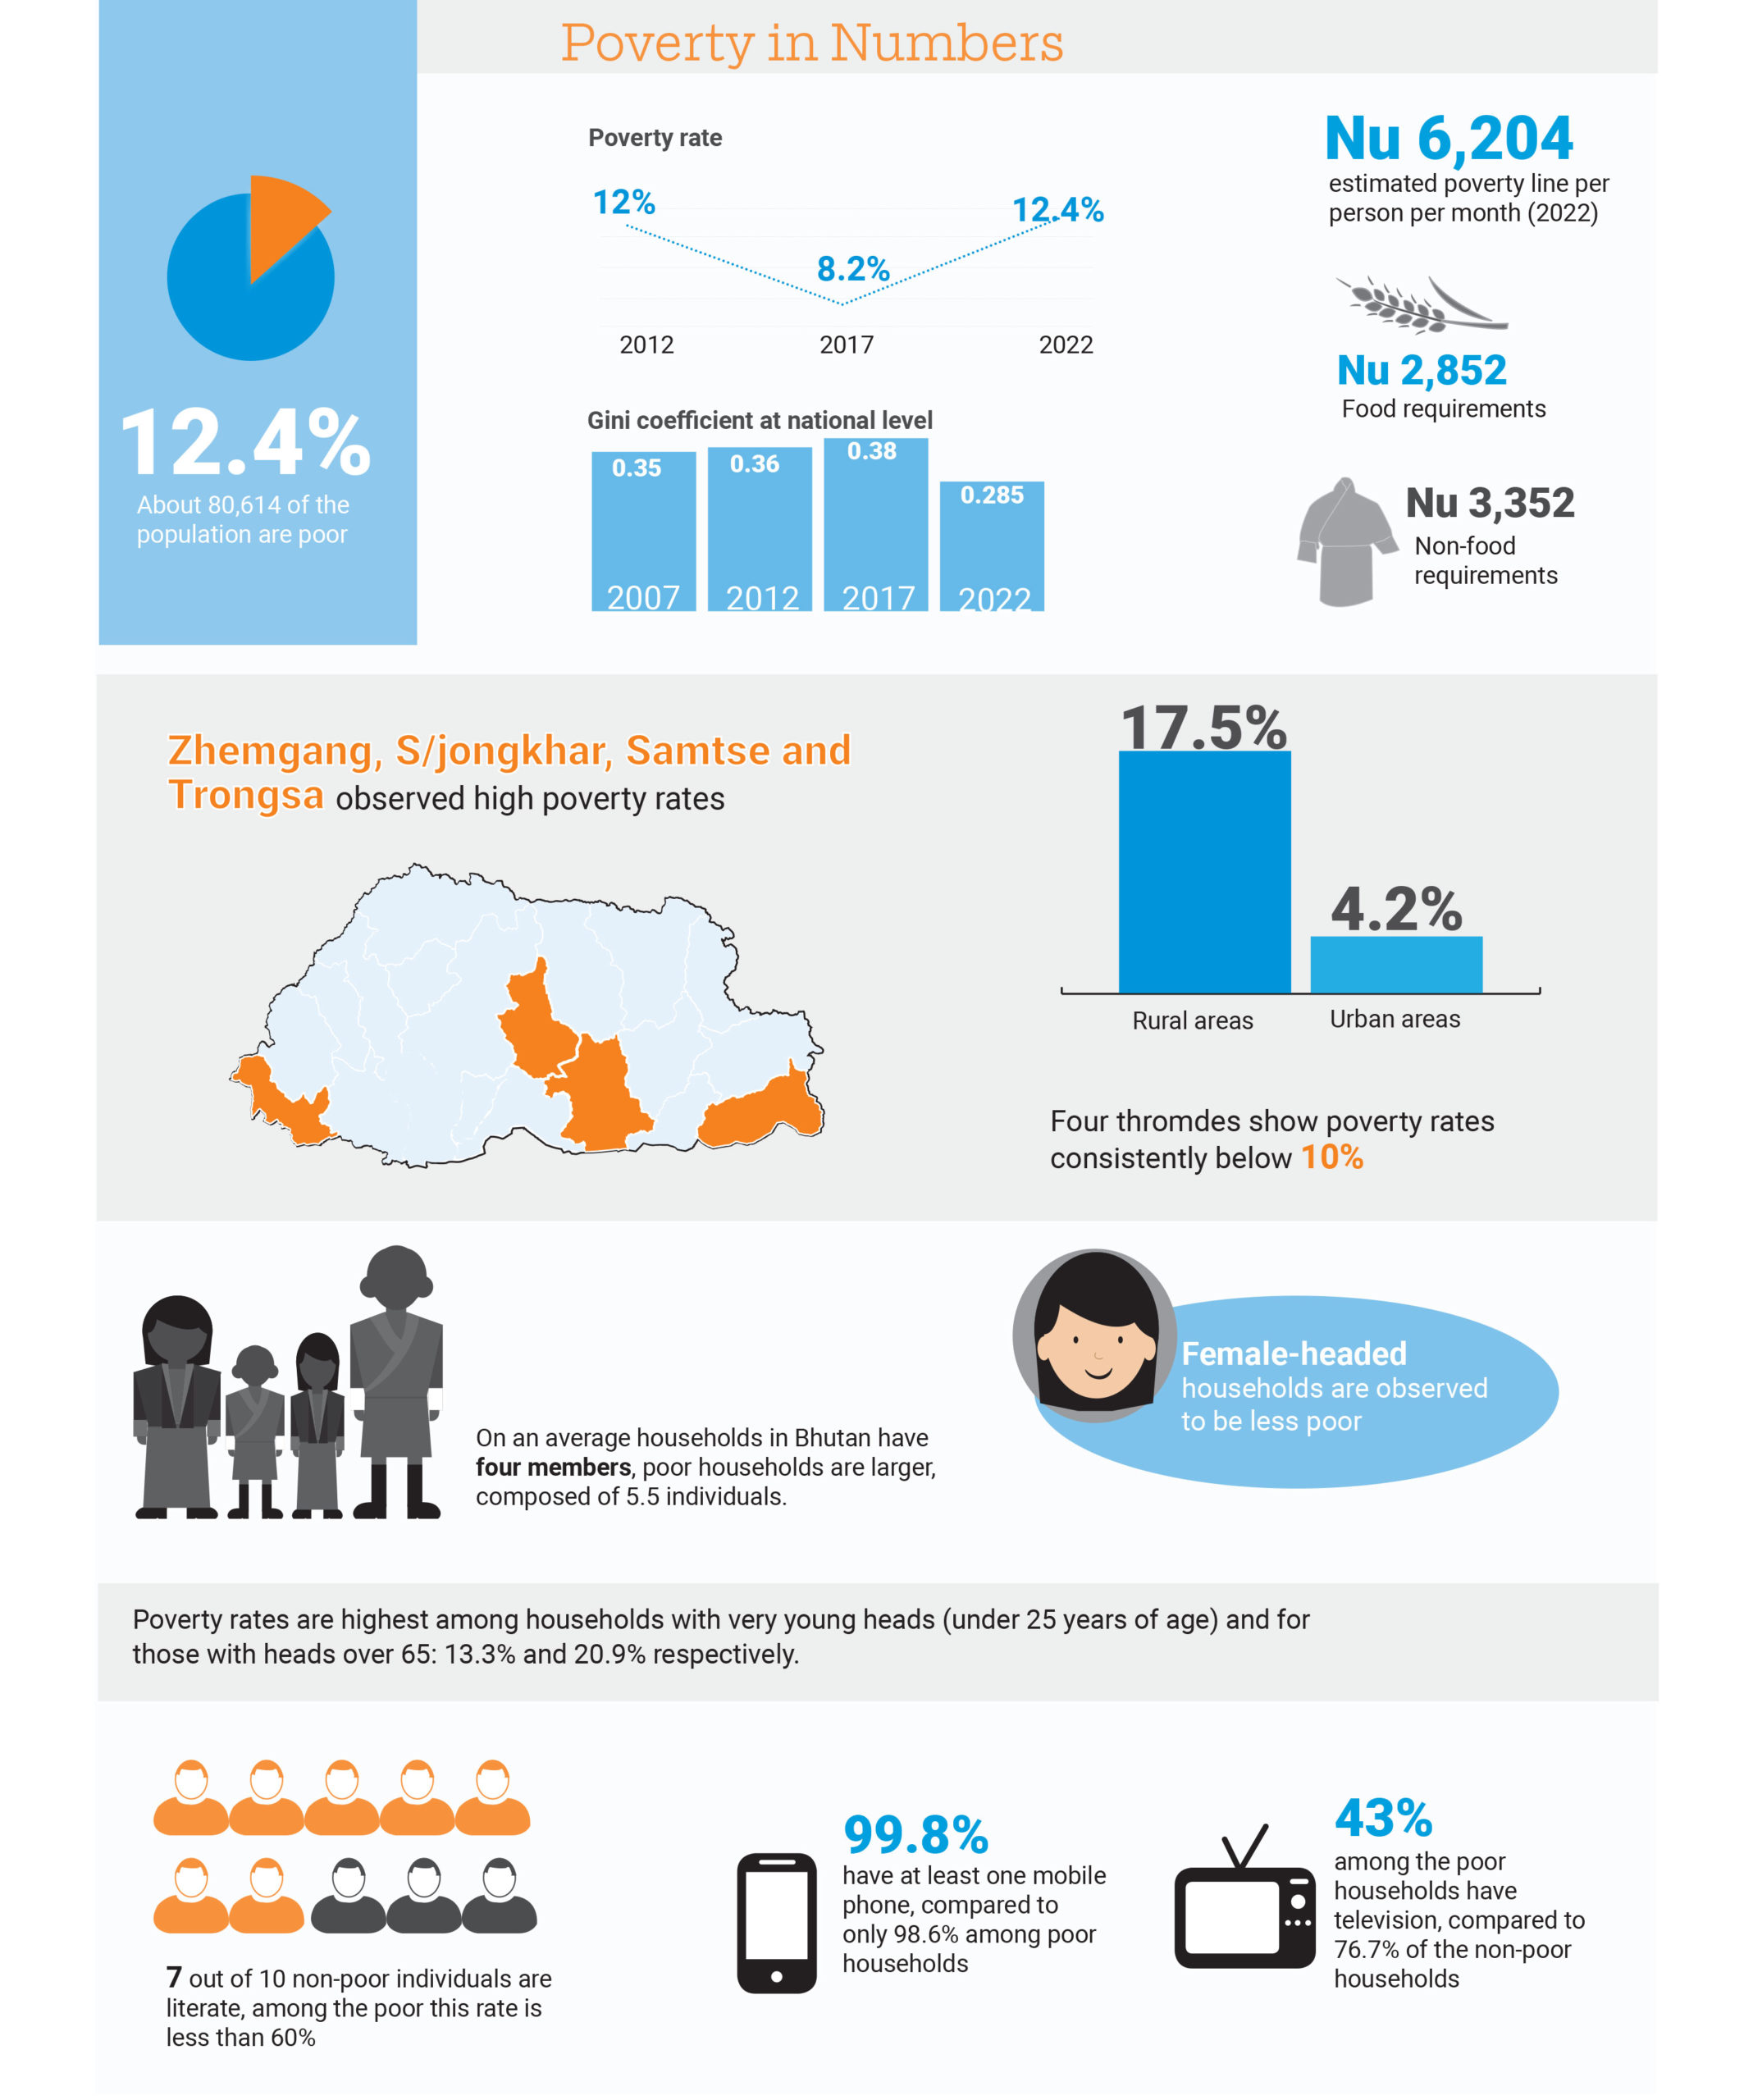
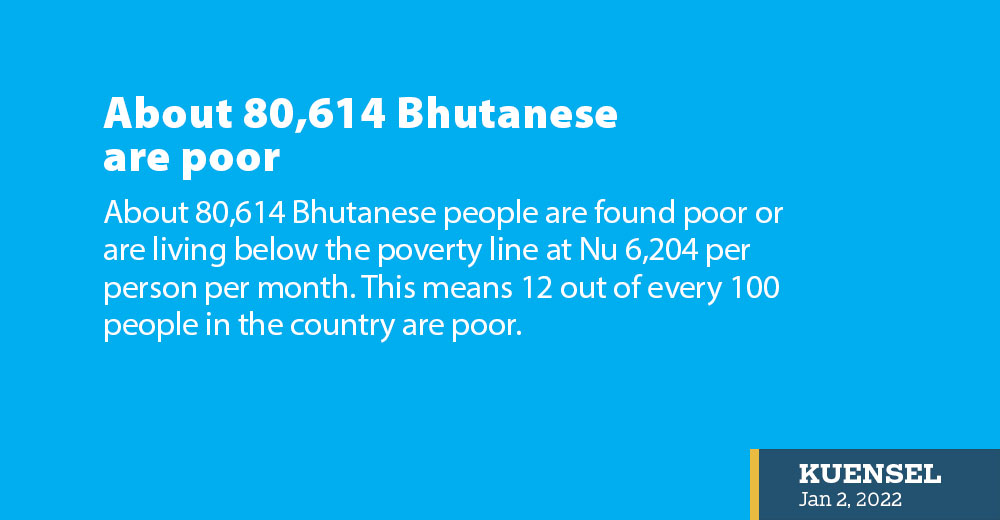
About 80,614 Bhutanese people are found poor or are living below the poverty line at Nu 6,204 per person per month. This means 12 out of every 100 people in the country are poor.
The total estimated population in the country was 650,118 in 2022.
The poverty rate estimated at 12.4 percent, according to the National Statistics Bureau’s (NSB) Poverty Analysis report 2022 released on December 31 last year, was higher than 8.21 percent in 2017 and 12 percent in 2012. About 56,865 Bhutanese were poor in 2017.
The poverty line at Nu 6,204 per person per month represents the level of consumption needed to secure the necessities of life. It is obtained by adding estimated food and non-food requirements of Nu 2,852 and Nu 3,352 respectively.
Subsistence poor, which means people belonging to households with per capita consumption below food requirements of Nu 2,852 per month, was reported at 0.4 percent of the population.
The population residing in rural areas recorded a high poverty rate at 17.5 percent while for urban areas it is low at 4.2 percent, the report stated.
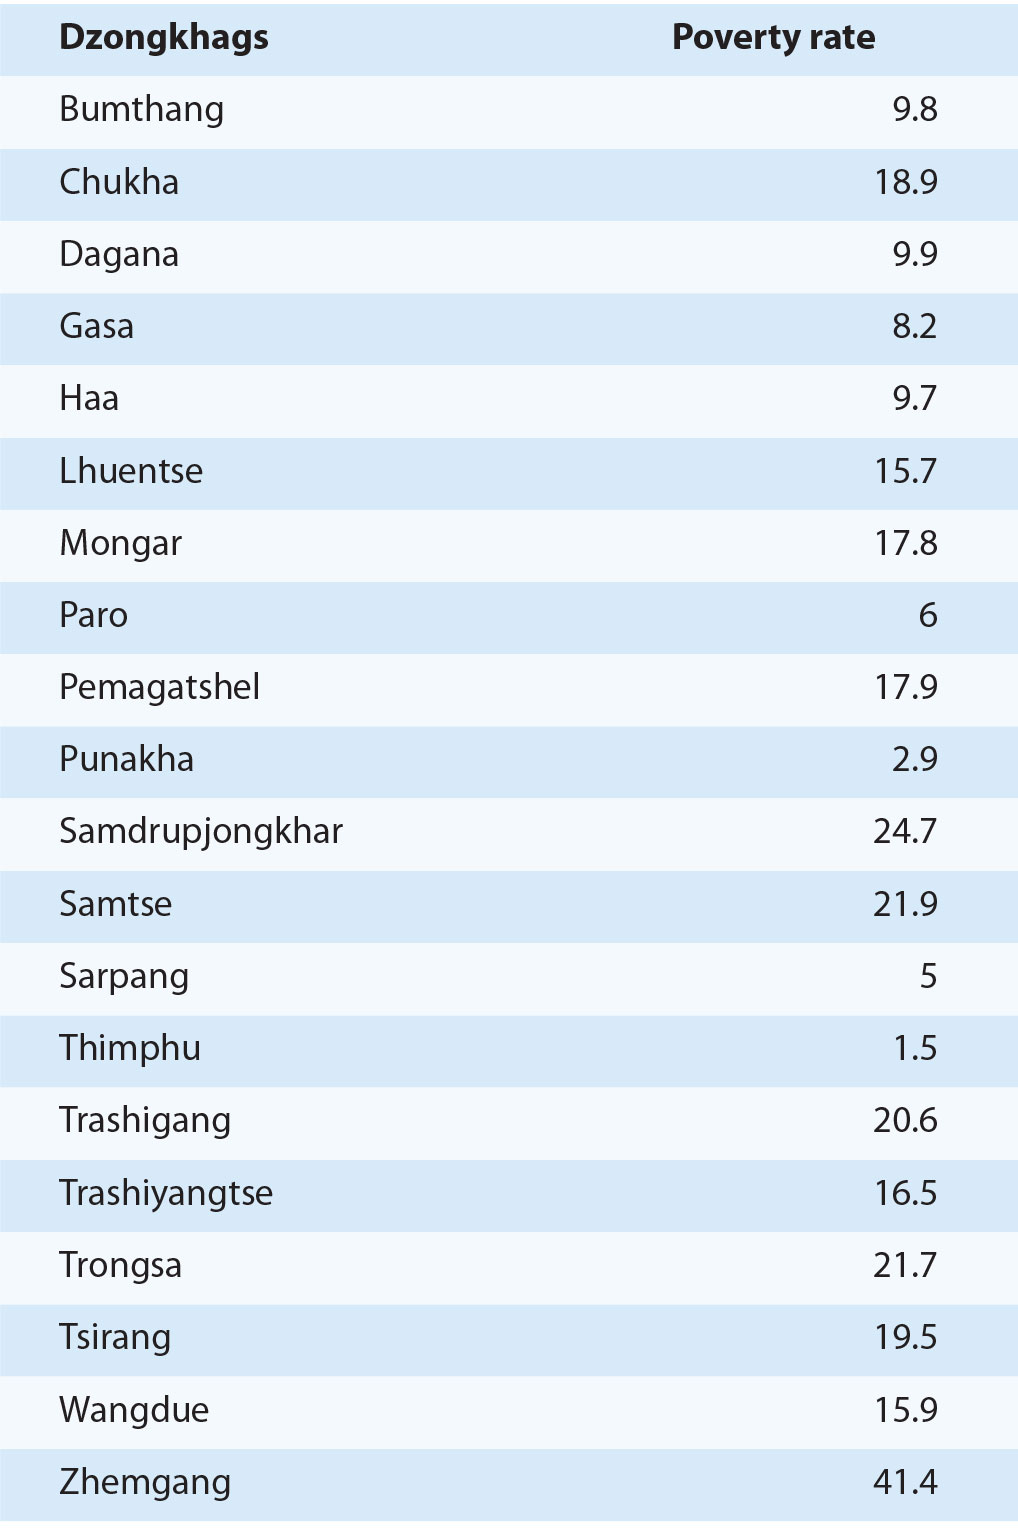
Zhemgang (41.4 percent), Samdrupjongkhar (24.7 percent), Samtse (21.9 percent) and Trongsa (21.7 percent) have the highest poverty compared to other dzongkhags. Thimphu at 1.5 percent and Punakha at 2.9 percent have the least poverty.
Four thromdes-Thimphu, Phuentsholing, Samdrupjongkhar, and Gelephu show the poverty rates consistently below 10 percent.
Bhutan has an average household size of four members while poor households have larger with 5.5 individuals. “The share of individuals in poverty is under 1 percent among households of only one member, and reaches 40.2 percent among households with nine members or more.”
Food poverty rates, less than food requirements of Nu 2,852 per person per month, are virtually zero for one-person households and reach 3.7 percent among the largest households (nine members or more).
The report also found that female-headed households are observed to be less poor than male-headed households.
Additionally, poverty rates are highest among households with very young heads (under 25 years of age) and for those with heads over 65, 13.3 percent and 20.9 percent respectively.
The report also found that the literacy rates among the poor are lower than for the rest of the population. “More than 7 out of 10 non-poor individuals are literate, among the poor the rate is less than 60 percent.”
Also, it added that the literacy rate is higher in urban areas both for poor (72 percent) and non-poor (83.2 percent) in comparison to rural areas (57.6 percent and 64.3 percent).
The report also stated that the non-poor population declared higher levels of sickness. “On average, while 20.3 percent of the poor population declared to have been sick in 2021, almost 29 percent among the non-poor stated to have suffered some illness.”
Irrespective of poverty status, the percentage of households with access to improved water sources was 100 percent.
At least 99.2 percent of households have access to improved sanitation; between poor and non-poor households, both in urban and rural areas, the disparity is around 1 percent.
Among the non-poor households, 99.8 percent have at least one mobile phone, compared to only 98.6 percent among poor households.
At the national level, only 43 percent of poor households have television, compared to 76.7 percent of non-poor households.
Gap between rich and poor
The Gini index, which measures inequality, is at 0.285 at the national level (0.29 for rural and 0.26 for urban). The Gini index saw a decline from 0.38 in 2017. Gini index was reported at 0.42 in 2003, 0.35 in 2007 but increased slightly to 0.36 in 2012.
On average the top 20 percent of the national population, equivalent to 37.3 percent consumes four times more than that of a person in the bottom 20 percent of the population (8.8 percent).
The Gini index ranges between 0 and 1, 0 expresses perfect equality, meaning every household has equal wealth possession. A Gini index of 1 (or 100 percent) expresses perfect inequality, meaning one household holds all the wealth.
The report was published by the NSB with support from World Bank experts.