
MB Subba
Consumer prices rose sharply from March to May in the wake of the Covid-19 pandemic, according to the Consumer Price Index (CPI) published recently by the National Statistics Bureau (NSB).
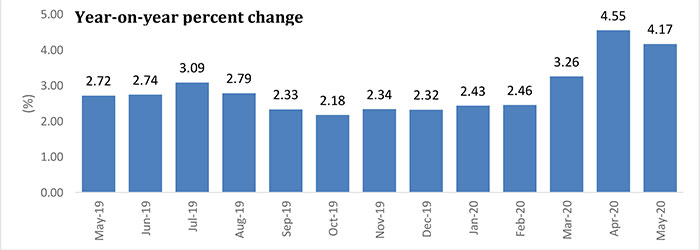
The year-on-year consumer price index (CPI) in May increased by 4.17 percent from May 2019. This means that on average, the consumers are paying 4.17 percent more than what they paid in May 2019 for goods and services.
The average inflation rate during the six months before the country detected its first Covid-19 case on March 5 had remained slightly over 2 percent.
The CPI is a measure of average price changes in the basket of goods and services purchased by households over time. It shows how much, on average, prices of goods and services have increased or decreased from a particular reference period.
The CPI rose sharply from 2.46 percent in February to 3.26 and 4.55 percent in March and April respectively.
As a result of the price increase in the economy, the Purchasing Power of Ngultrum (PPN) dropped by 5.6 percent in the past 12 months from May 2019 to May 2020, the NSB report states.
According to the statistics, the purchasing power as measured by CPI was Nu 66.9 as of May 2020.
This means, Nu 100 in May 2020 is worth only Nu 66.9 at December 2012 price.
Among all the goods and services, food prices saw the highest increase in the wake of the pandemic. The percentage increase in the prices of food for the months of March, April and May were 6.53, 9.24 and 8.76 percent respectively.
The prices of food and non-alcoholic beverages also rose by 8.99 percent in May. In the same month, the prices of alcoholic beverages and betel nuts increased by 5.73 percent.
However, non-food goods saw a low inflation of 0.42 only. Similarly, the inflation in May was 3.14 percent for clothing and footwear, and 1.23 percent for housing and utilities.
Overall, transport, communication, recreation, and restaurants and hotels saw negative inflation. Furnishings, household equipment and routine household maintenance recorded a price rise of less than 2 percent.
The statistics show that the education CPI increased by 3.78 percent.
According to NSB, the CPI covers the goods and services consumed by the households and a sample of goods and services are selected using the household expenditure data to measure the inflation experienced by the households.
Prices of the sampled goods and services are collected from urban areas in 20 dzongkhags on monthly, quarterly and annual frequency depending on the price volatility of the items.