
Trends variations in absolute temperature
Right temperature, rainfall and moisture have been the allure of all creatures that they responded historically by migrating to places where they can find these conducive conditions. Broader experiences of happiness depended on them. Climate boiling is a new phrase coined by the UN SG to signal the risks to the experiences of right temperature and moisture (The Guardian, 27.7.23).
Thanks to the Department of Meteorology, in 20 weather stations installed one each in every district daily max and min temperatures, in addition to other variables such as rainfall and subsoil temperature, are recorded. Temperature measures the warmth of surface air whereas subsoil temperature could be useful information for farming. Most weather stations were opened in 1996. Two weather stations were installed more recently: Gasa station in 2004 and Tangmachu station in 2006. The operation of weather stations has led to generation of 1,98,000 data points on max and min temperature till 2022.

Daily temperature recorded by weather stations and reported in the media is absolute temperature; it is not expressed as a deviation from any baseline or reference temperature. Absolute temperature data collected over the last 27 years enables us to calculate the baseline max temperature, which is 22.074°C, and the baseline min temperature, which is 12.284°C. The formula for computation of baseline or reference temperature is quite simple: Baseline or reference value= ∑(x–x̄) where, x is the value of temperature for a year, and x̄ is average temperature of the whole country from 1996 to 2022.

We can also calculate diurnal temperature from absolute temperature data for the last 27 years. Diurnal temperature is the difference between absolute max and absolute min temperature. The average diurnal difference is 9.823°C. Diurnal temperature has grown slightly larger over time because of a gradual increase in the difference between max and min temperature.
Temperature anomaly: Bhutan warmer by 1.02°C in the last 27 years, with a yearly rise by 0.0378°C
To find global temperature rise, a 30-year average temperature over the period 1991-2020 is used as the baseline temperature. There can be positive temperature anomaly or negative temperature anomaly around the baseline temperature. Positive temperature anomaly means that the trend is above the baseline temperature. The method of computing temperature anomaly is different from that of finding average of absolute temperature. Forecast of rise of 1.5ºC global temperature means an increase of temperature by that extent above the 30-year average estimated for the period 1991 to 2020.
Analyzing the primary temperature data for the last 27 years pertaining to Bhutan allows us to estimate temperature anomaly which provides quantitative evidence of climate change rather than weather change. There are two steps in estimating temperature anomaly. The first step involves finding the baseline temperature for Bhutan, which is 22.074°C for max temperature. Having obtained the baseline value, the second step is to calculate the magnitude of change. Yearly deviations from the baseline value for max temperature were calculated to find the magnitude of change in max temperature anomaly. The magnitude of change for either positive or negative anomaly is estimated by using Sen’s Slope Estimator (Theil, 1950; Sen, P. K. (1968). Theil-Sen non-parametric technique for estimating linear trend of temperature anomaly is robust and insensitive to outliers.

Maximum temperature anomaly in Bhutan has risen by 1.02°C between 1996 and 2022. Max temperature anomaly has been increasing by 0.0378°C every year. At 95% confidence level, 0.0378°C lies between lower limit of 0.001°C and upper limit of 0.074°C. Min temperature anomaly for Bhutan for the same period show that min temperature has decreased by 1.586°C (-1.585°C). Min temperature anomaly has been decreasing every year by 0.0587°C (-0.0587°C). We are 95% confident that -0.0587°C lies between lower limit of -0.00029°C and upper limit of -0.127°C.
Minimum temperature anomaly has a sharper downward, cooling trend. Decreasing temperature around the mean for min temperature anomaly are observed in many cases of climate studies. Given the yearly increase in max temperature anomaly on the one hand, and the yearly decrease in min temperature anomaly on the other, there is a long-term trend for the climate to become more extreme between summer and winter.
Rainfall and river volume
GNH survey of 2022 found that 67% of farmers say there is either too much rain or too little rain for farming depending on location. Responses of farmers indicate that central Bhutan (Mandge & Chamkharchu valleys) are less affected by untimely or insufficient rainfall compared to Kurichu valley and Western Bhutan. A higher proportion of farmers in western and eastern Bhutan reported lack of timeliness and adequacy of rainfall. Many individuals have attributed, rightly or wrongly, drying of streams and lakes to climate warming. Their views need to be corroborated by rainfall observations.

The last 27 years’ rainfall data should reveal long-term rainfall patterns. Though there is fluctuation in the precipitation level around the trend line, no clear decrease in annual cumulative rainfall can be observed in the data in most weather stations, and thus the whole country. Although there is year to year variations in cumulative rainfall, a lack of evidence for any long-term decrease in annual cumulative rainfall suggests that drying of streams and lakes that do not depend on glaciers as sources might be due to expanding young forest pulling up water, especially in dry seasons. As there is no significant evidence for any decreasing trend for annual cumulative rainfall, reports about lack of timeliness and adequacy of rainfall might suggest variability or randomness in cumulative annual rainfall, which there is as shown by high coefficient of variation, as well as temporal shift in rainfall. Rainfall might be happening with less synchronicity with farming cycle. Intensity of rainfall associated with positive temperature anomaly is an increasing hazard. For every 1°C warming, Clausius-Clapeyron Equation shows the atmosphere can hold 7% more water vapor ( Krey, U. & Owen, A. 2007, p. 359). Climate warming causes more evaporation, which can lead to stormy rainfall. A higher proportion of southern and eastern Bhutanese farmers reported windstorm and torrential rains in the preceding one year during GNH survey 2022.
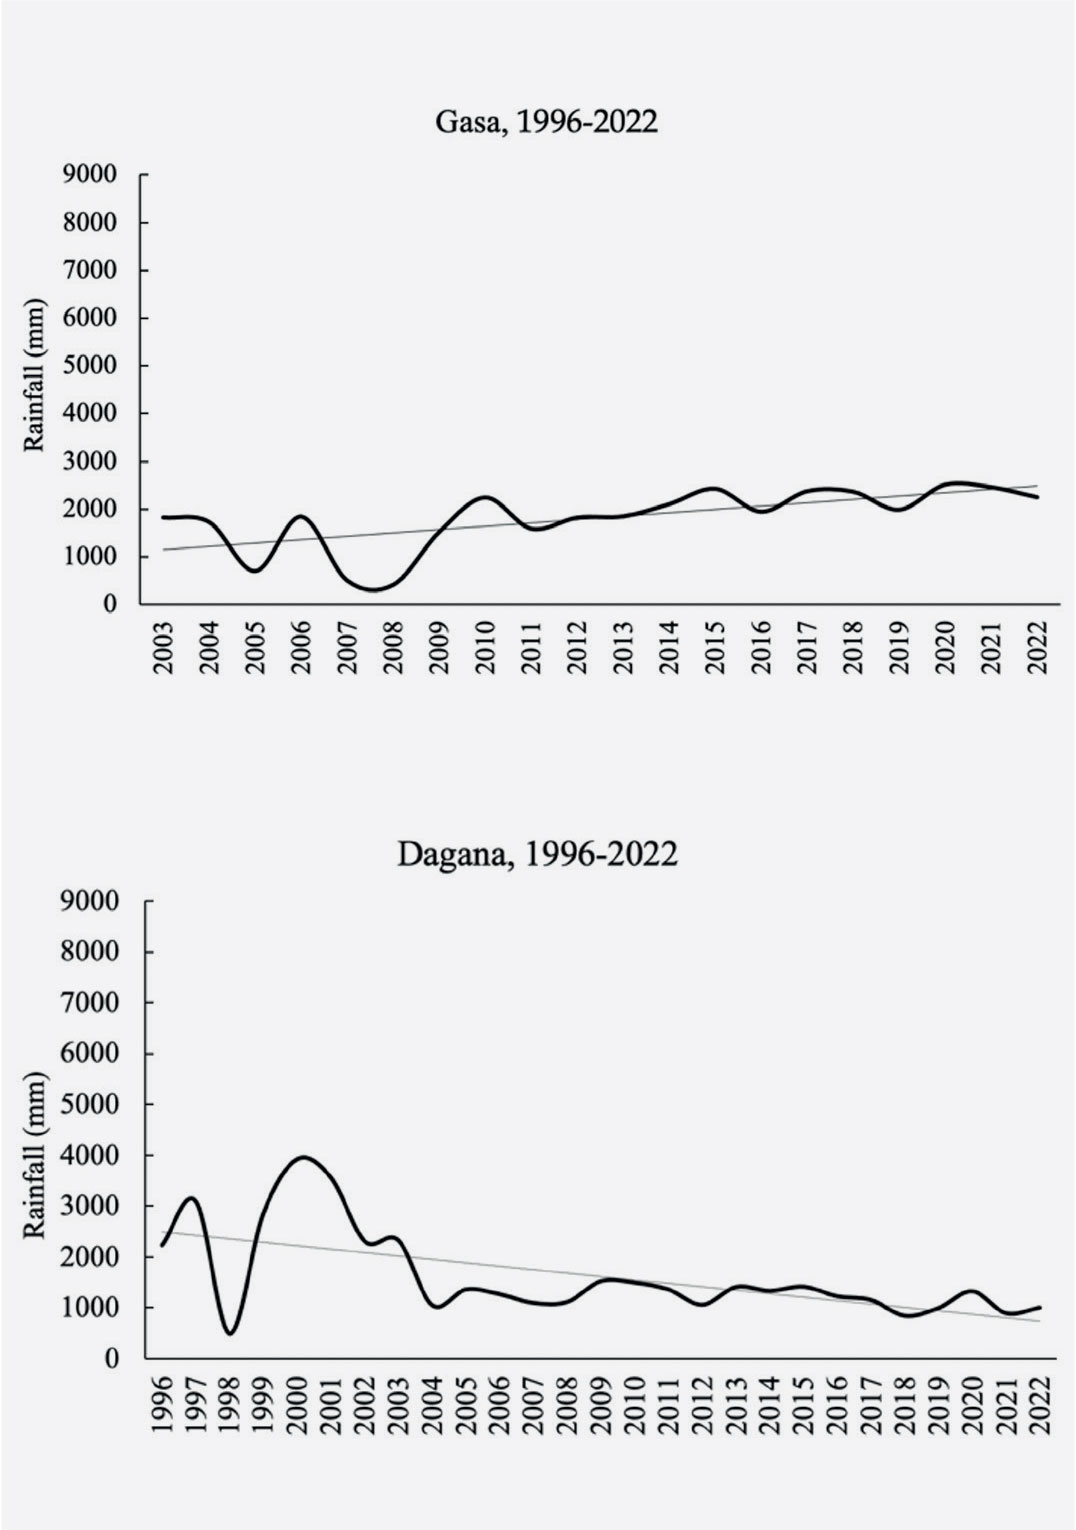
However, among weather stations there are two exceptions. Firstly, data shows that Dagana has been getting drier, with decreasing trend in annual cumulative rainfall. The only place where trend line for precipitation is sloping upward, leading to wetter conditions over time, is Gasa. It is quite likely that the trend experienced by Gasa is applicable to similar northern latitude. Coefficient of variation of annual cumulative rainfall (standard deviation divided by mean of annual cumulative rainfall) is very high (54%) for Dagana, and high (35%) for Gasa. Mean annual cumulative rainfall for Gasa for the last 27 years is 5186 mm with standard deviation of 930. Mean annual cumulative rainfall for Dagana for the same period is 1610 mm with standard deviation of 865.
Coefficient of variation measures the degree of dispersion of annual cumulative rainfall around its mean. A higher coefficient means a greater spread of data around its mean. Among weather stations, the only other place where annual cumulative rainfall varies so unpredictably is Phuntsholing, and it is attested by very high coefficient of variation (42%). Annual cumulative rainfall ranged from 1681 mm in 2008 to 8256 mm in 2022 – a five-fold difference. The mean annual cumulative rainfall in Phuntsholing, Sipsu and Bhur are highest in the country. Construction in these areas will have to incorporate far more future overflow scenarios. Among weather stations, Paro, Punakha, Wangdi and Semtokha are driest, with mean annual cumulative rainfall below 666 mm.

Rainfall across seasons and years has evoked more interest among hydropower community in Bhutan. Waangchu river flow in cubic meter per second (m3/s) has been recorded daily at Chukha dam since 1976 because of Chukha hydropower plant. Volume of the river measured in m3/s is obviously highest during summer, and decreases from autumn to winter before rebounding gradually in spring. Water flow has been susceptible to high randomness during summer compared to other seasons as indicated by high coefficient of variation of summer flow. Waangchu flow reached lowest point of 76.88 m3/s in 1992 and the highest flow of 133.84 m3/s in 1984. Kurichu flow ranged from 247.12 m3/s in 2015 to 431.4 m3/s in 1998. The arithmetically appropriate way to average river flow is geometric mean. For example, the arithmetic mean of m3/s of Waangchu for the last 47 years is 95.17 but m3/s calculated by geometric mean is 64.6. It is clear from the difference that using arithmetic mean, as it has been done so far, exaggerates m3/s. The volume of Waangchu show relatively, mild decreasing trend over the decades, but I attribute this more to upstream urbanization’s depletion of water sources rather than rainfall decrease. But the allegation in some quarters that Waangchu will dry up soon due to climate change seems happily to be scare mongering—at least for now.
Contributed by
Karma Ura
with research assistance from Kinley Pema and Jigme Phuntsho